New Data Adapter: JDK Flight Recorder
It has been a pretty long time since we’ve added support for a new data source in binjr, but coming up in release 3.13 is something quite new indeed: support for recordings produced by JDK Flight Recorder (JFR, for short).
So what, exactly, is JFR? To quote Wikipedia:
JDK Flight Recorder is an event recorder built into the OpenJDK Java virtual machine. It can be thought of as the software equivalent of a Data Flight Recorder (Black Box) in a commercial aircraft. It captures information about the JVM itself, and the application running in the JVM. There is a wide variety of data captured, for example method profiling, allocation profiling and garbage collection related events. The technology was open sourced in 2018.
Analysis and visualization of flight recordings are normally done using JDK Mission Control (JMC).
Every single event recorded by JFR naturally includes a timestamp, making it a pretty straight-forward source of data for binjr, one that can certainly benefit for the freeform navigation and dynamic view composition binjr allows.
Binjr Is Not a JMC Replacement
At least not for the time being; the initial plan is to play on the strength of the app and bring what it does well (browsing trough time series) to JFR recordings, not try to achieve feature parity with JMC, nor make binjr a fully-fledged profiler.
Later down the line, we will probably consider adding some new visualization type, more specifically oriented to data types contained in JFR recordings, when those make sense and mix well with the other existing one, and more generally speaking, work well within the time-based navigation paradigm in binjr.
For example, the idea of a flame-graph representation for method profiling data that can be refined on selecting the events in specific period on a time line sounds quite promising and would be a naturally fit for binjr’s navigation’s style (and AFAIK, not something that is easily done in JMC at the moment).
What’s in the box?
But this is The Future™ (maybe…), not what we have right-now. So what do we have, then?
It takes the form of a single Data Adapter which add a new source type aptly named “JFR”.
Upon opening a .jfr file using this adapter, two distinct sources are added to the workspace; both offer a hierarchical view of the various types of events recorded in the file, but allow for a different visualization type for the items they expose.
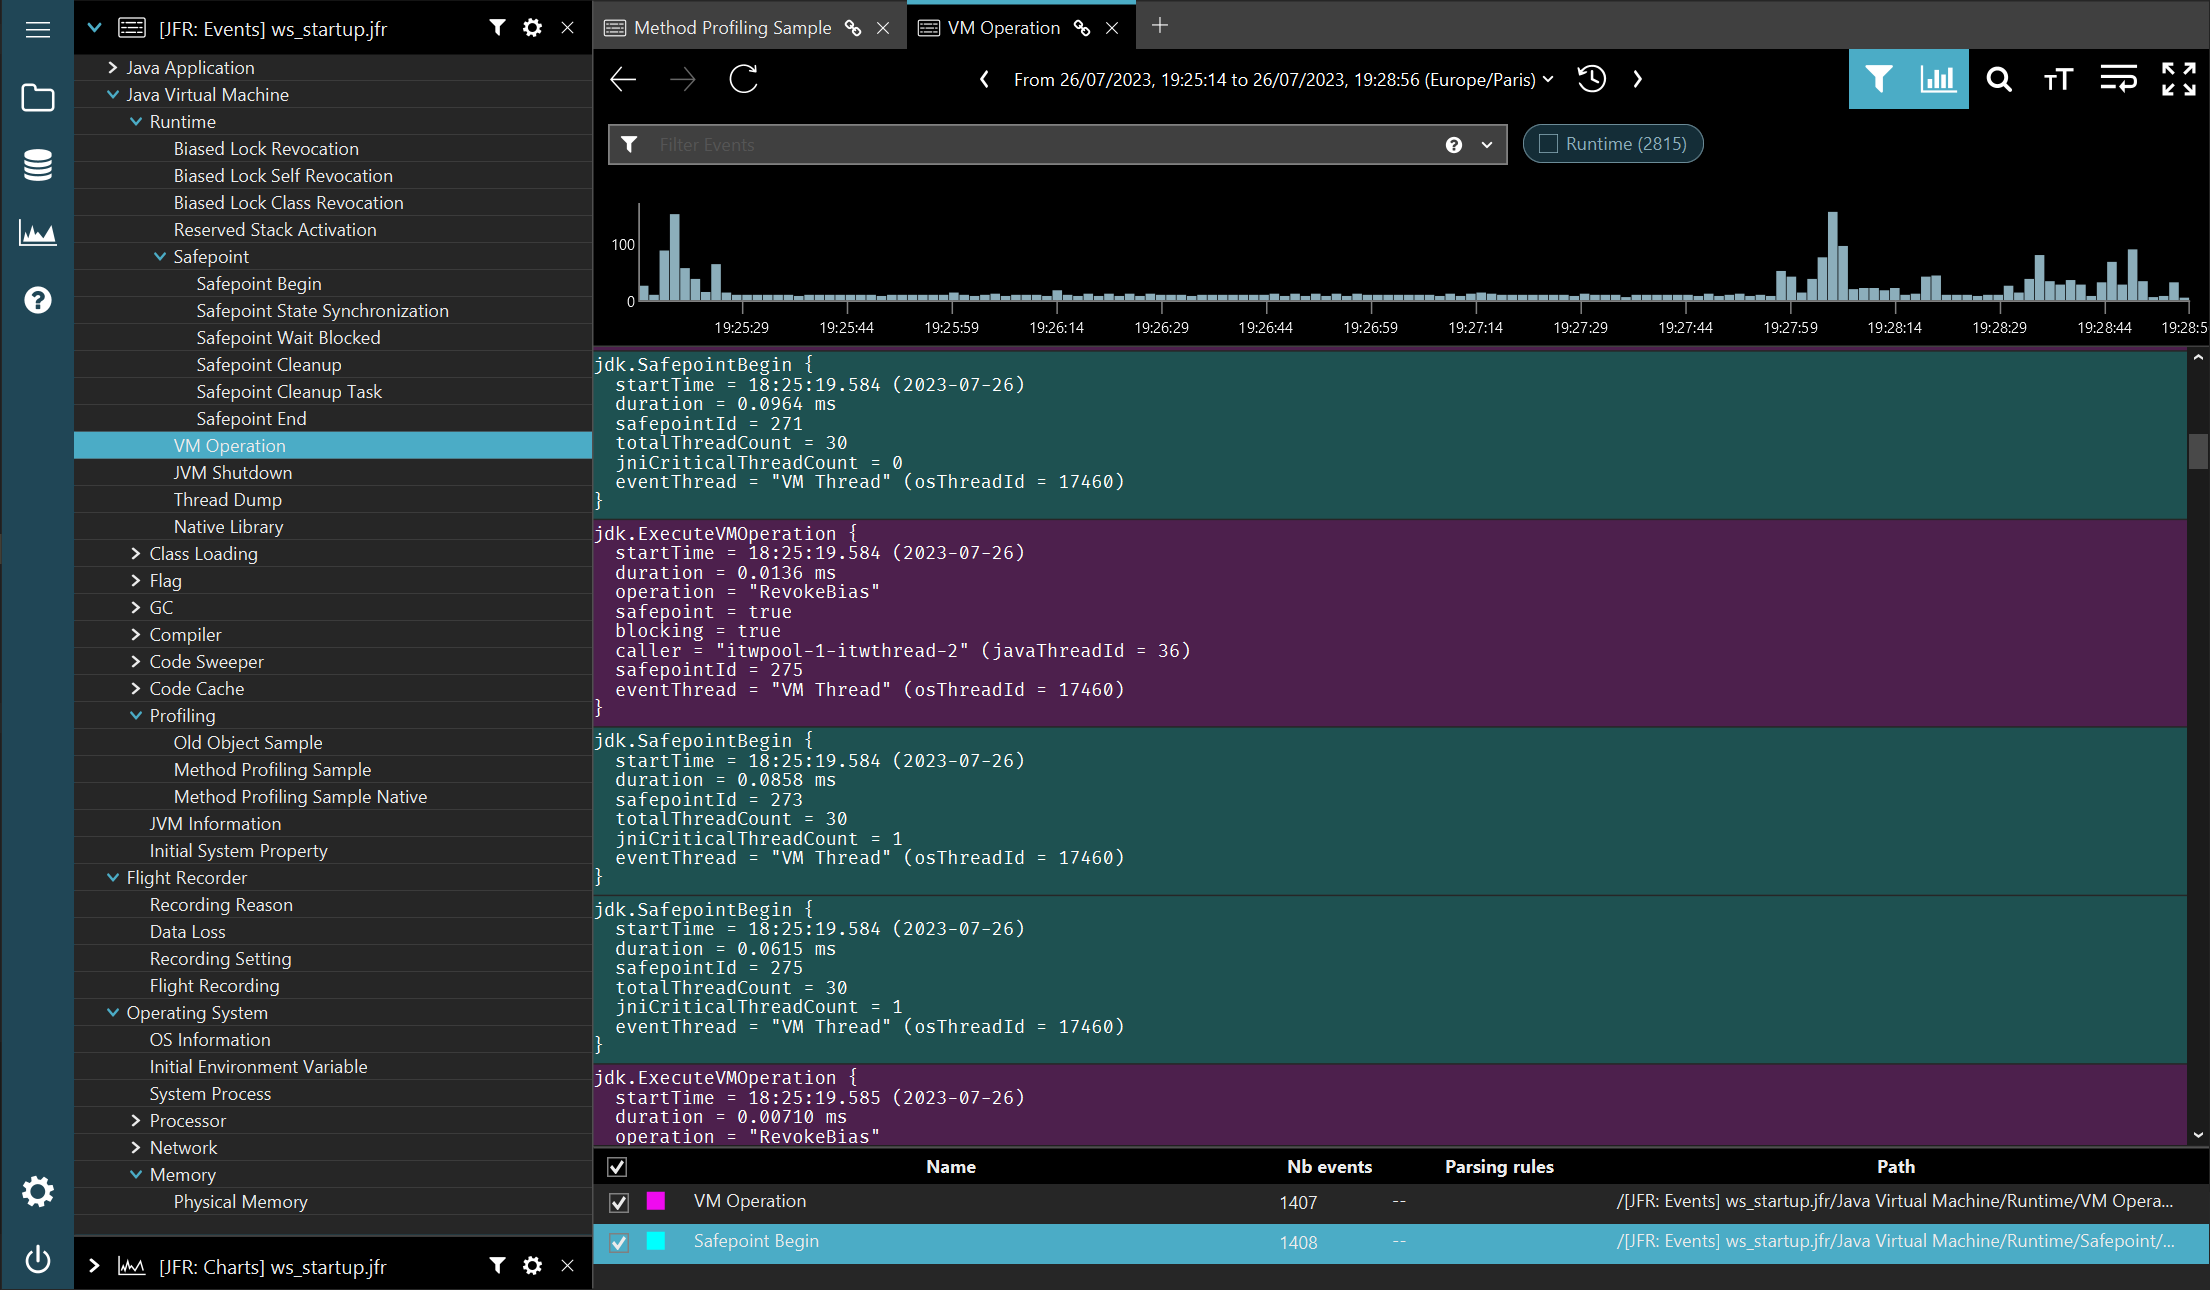
The JFR:Events source
When dragging items for the source named [JFR: Events] my_recording.jfr onto the worksheet area, a view similar to that used for log files is created and a textual representation of the selected events are shown.
Like for log files, you can keep on adding more even types onto the same page, and use the filtering box to refine the event view based on their textual content and the event density histogram to filter out on their timestamps.
In essence, the core experience is fundamentally that of using the jfr command line tool and grep/sed/awk’ing the results in a terminal emulator, while offering all the refinements of the binjr UI: dynamic coloring for event types, fast index-based filtering, facets computation, visual representation of the events occurrence on a timeline and the ability to persist the entire state of a session at anytime, to re-open later or share.
But he most useful feature might possibly be that you can seamlessly merge on a single view events coming from different JFR recording files or, for that matter, any other source compatible with the event visualization (now handily identified by a small icon next to a source pane or worksheet tab’s title).
This makes it remarkably easy to produced a unified and dynamically filterable view of a series of events that don’t have the same point of origin, like getting the full picture from the exchange between a client and its server by mixing events from 4 different sources; a jfr recording for both the client and server processes, as well as the log files produced by each application.
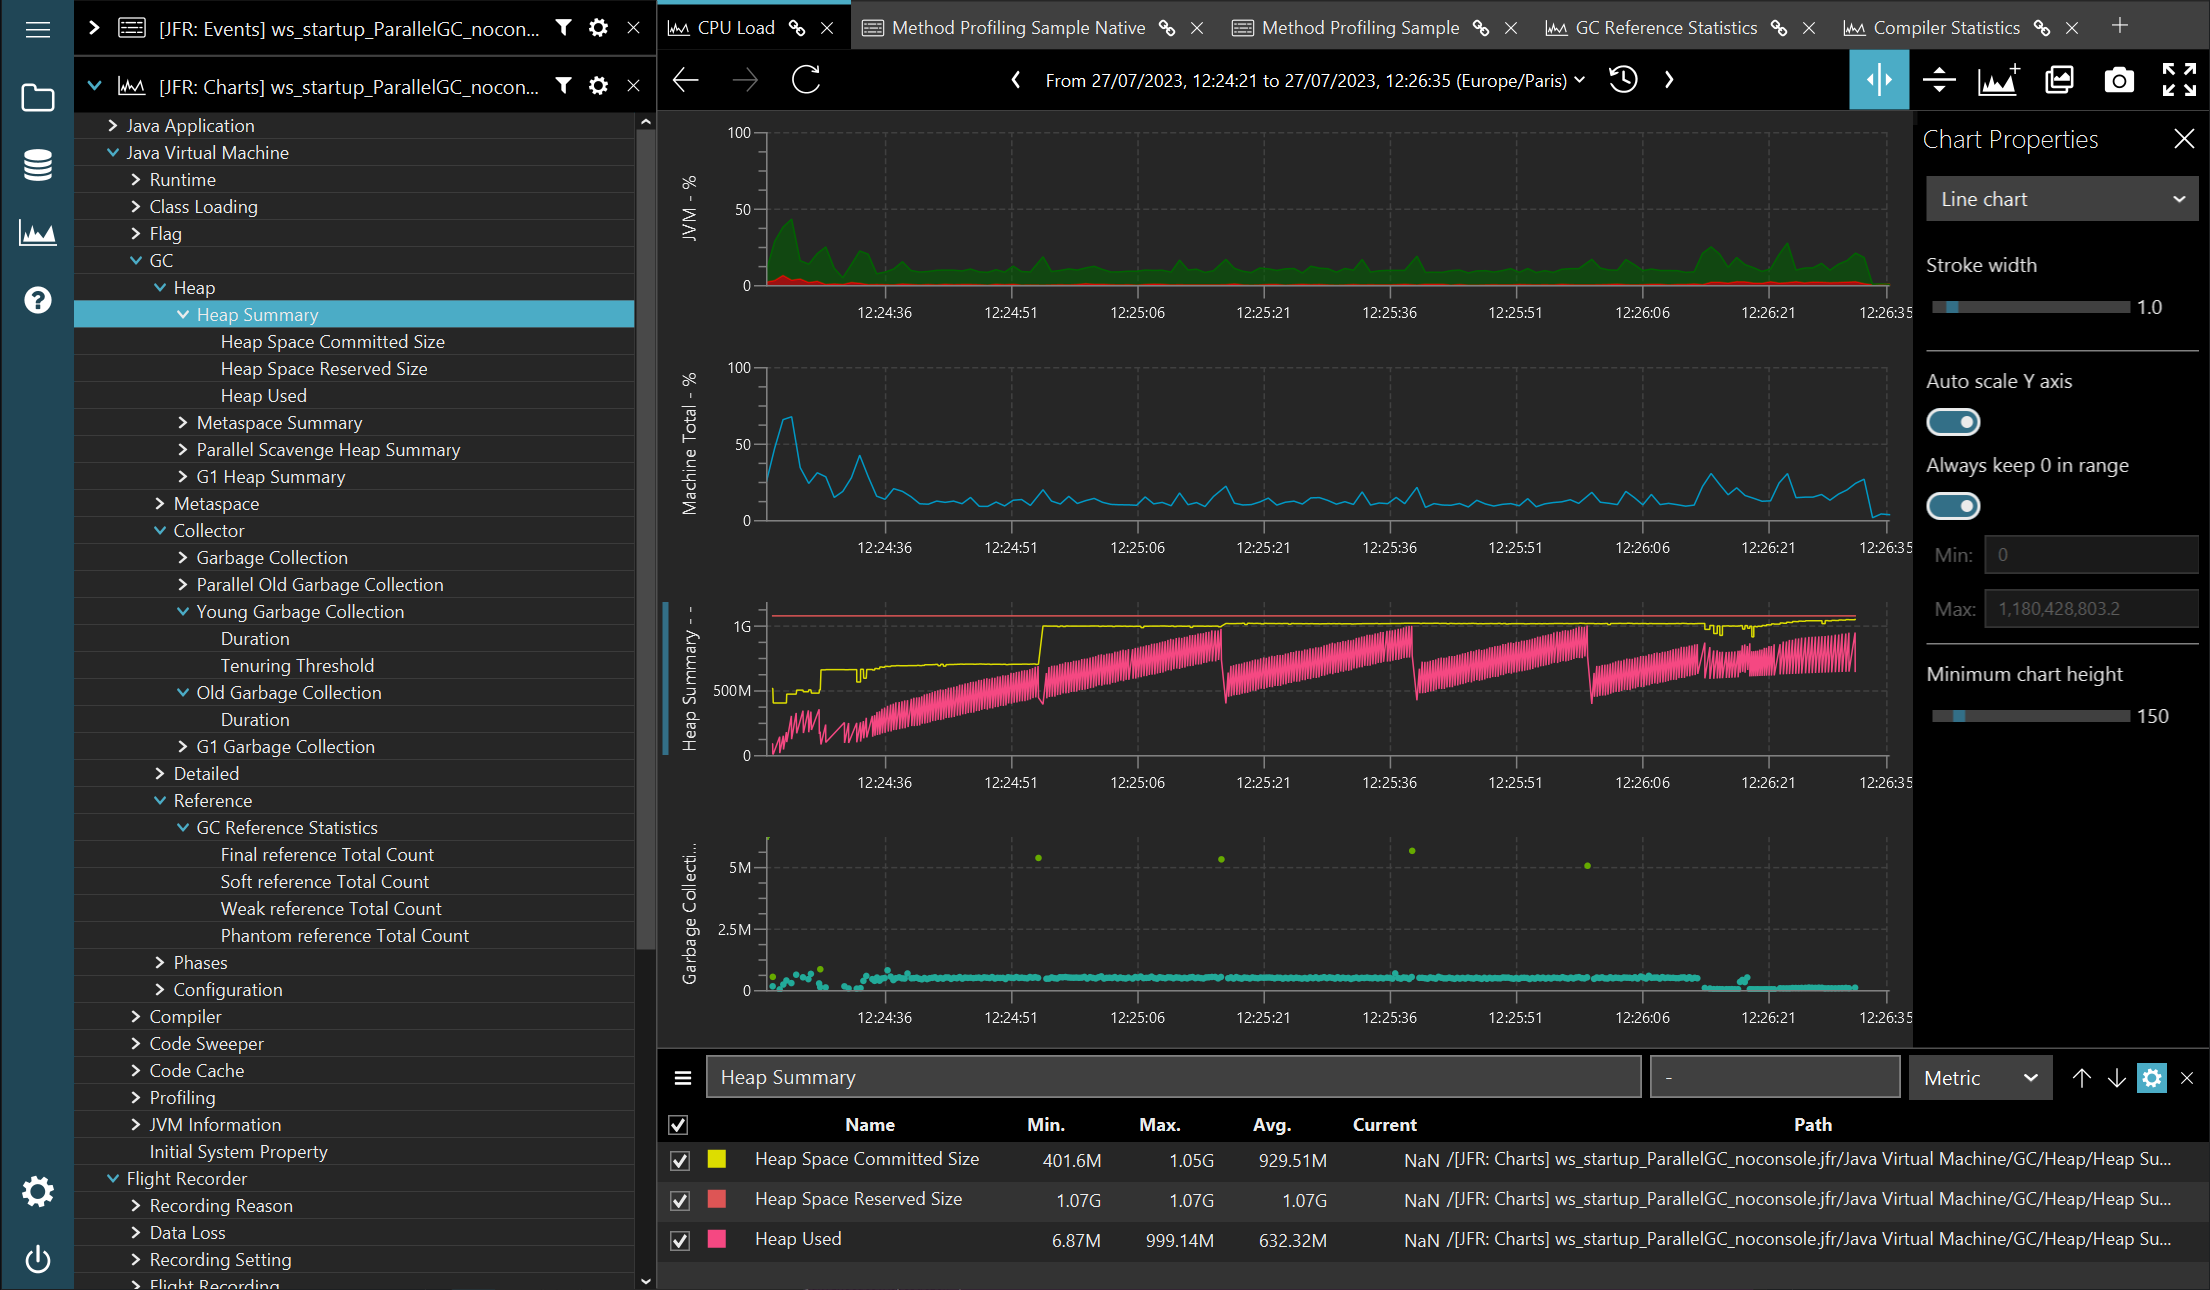
The JFR:Charts source
The JFR Charts source is very reminiscent of the core binjr experience: it allows for every types of event in a JFR recording that contain fields typed as numbers to be plotted as time series on various types of charts.
Plotting values over time makes perfect and immediate sense for a majority of all the available numeric field in JFR, like in the case of CPU usage or heap statistics, while for some others… well… not so much!
For thing like memory addresses or identifiers, well, let’s just say that it makes for some “interesting” charts…
For now, the majority of event fields are presented in their raw form, but as the adapter matures, more and more specialization will be added, to prune out the fields that make no sense in plotting (like the aforementioned memory addresses or thread ids, etc…) and limit the amount of noise in the UI. An other kind of special treatment for events is when the value of a field determines a category that is worth distinguishing as a distinct sources, like in the case of the Reference type counts in the GC category, where the kind of reference (final, soft, weak, phantom) is conveyed by a field’s value rather than an event type.
Again, like for the JFR:Events source, there’s nothing stopping you from mixing in any given charts metrics from a JFR recording with some others coming from different sources, like your Netdata or JRDS monitoring system, or from ad-hoc data gathered in CSV or RRD files.
Visualizing events and charts in sync
Although it is not possible to mix events and charts in a same worksheet, it is nonetheless possible to link the timelines of several worksheets, so that changes applied to one apply to the other ones, keeping them in sync.
Used together with the ability to detach worksheets from the main window, you can then compose dynamic rich views, that allow for peeking into events and charts simultaneously:
What’s next?
This is the first draft for this new adapter, and we’re planning on expanding its capabilities in the future.
As mentioned before, support for flame graphs is very much one that we will be looking to add next. Other features, such as the ability to plug directly into a running JVM and stream events in real time, may come later on, but we can’t make any promise as it might prove more difficult to integrate within binjr’s core feature set and philosophy.
With all that said, the adapter in its current state is working well, and we think it can be of some real use; please give it a try and do not hesitate to by leave a comment below and share your thoughts on what works, what doesn’t and what is still needed to make it a really unique and useful tool.
Thank you and happy profiling!